
Svetlana Sedykh
Business Intelligence & Reporting Analyst
Clear Insights. Better Decisions.

About Me
Welcome. My name is Svetlana Sedykh. I am a France-based Business Intelligence and Reporting Analyst and a Microsoft Certified: Power BI Data Analyst Associate.I have been developing Power BI solutions since 2023, specialising in business performance and financial reporting. My work covers the full reporting process, from understanding business requirements and working with data sources to data modelling, analysis, and report development.My background in Economics and Accounting, combined with technical expertise, allows me to understand both the data and the business context behind it.I invite you to explore a selection of my Power BI projects to see examples of my work and the types of reporting solutions I develop.

My Expertise
Analyse data to identify trends, patterns and performance drivers
Build clear and intuitive Power BI dashboards and reports
Translate business requirements into meaningful KPIs and reporting
Analyse actual performance against targets, budgets and prior periods
Present complex information clearly to support business decisions
Technical Skills
Power BI · DAX · Power Query · SQL · Excel · Data Modelling · Microsoft Copilot · Copilot Studio
Sales Performance Dashboard
This premium four-page Sales Performance Report delivers a full view of business performance, providing product, customer and geographic insights.
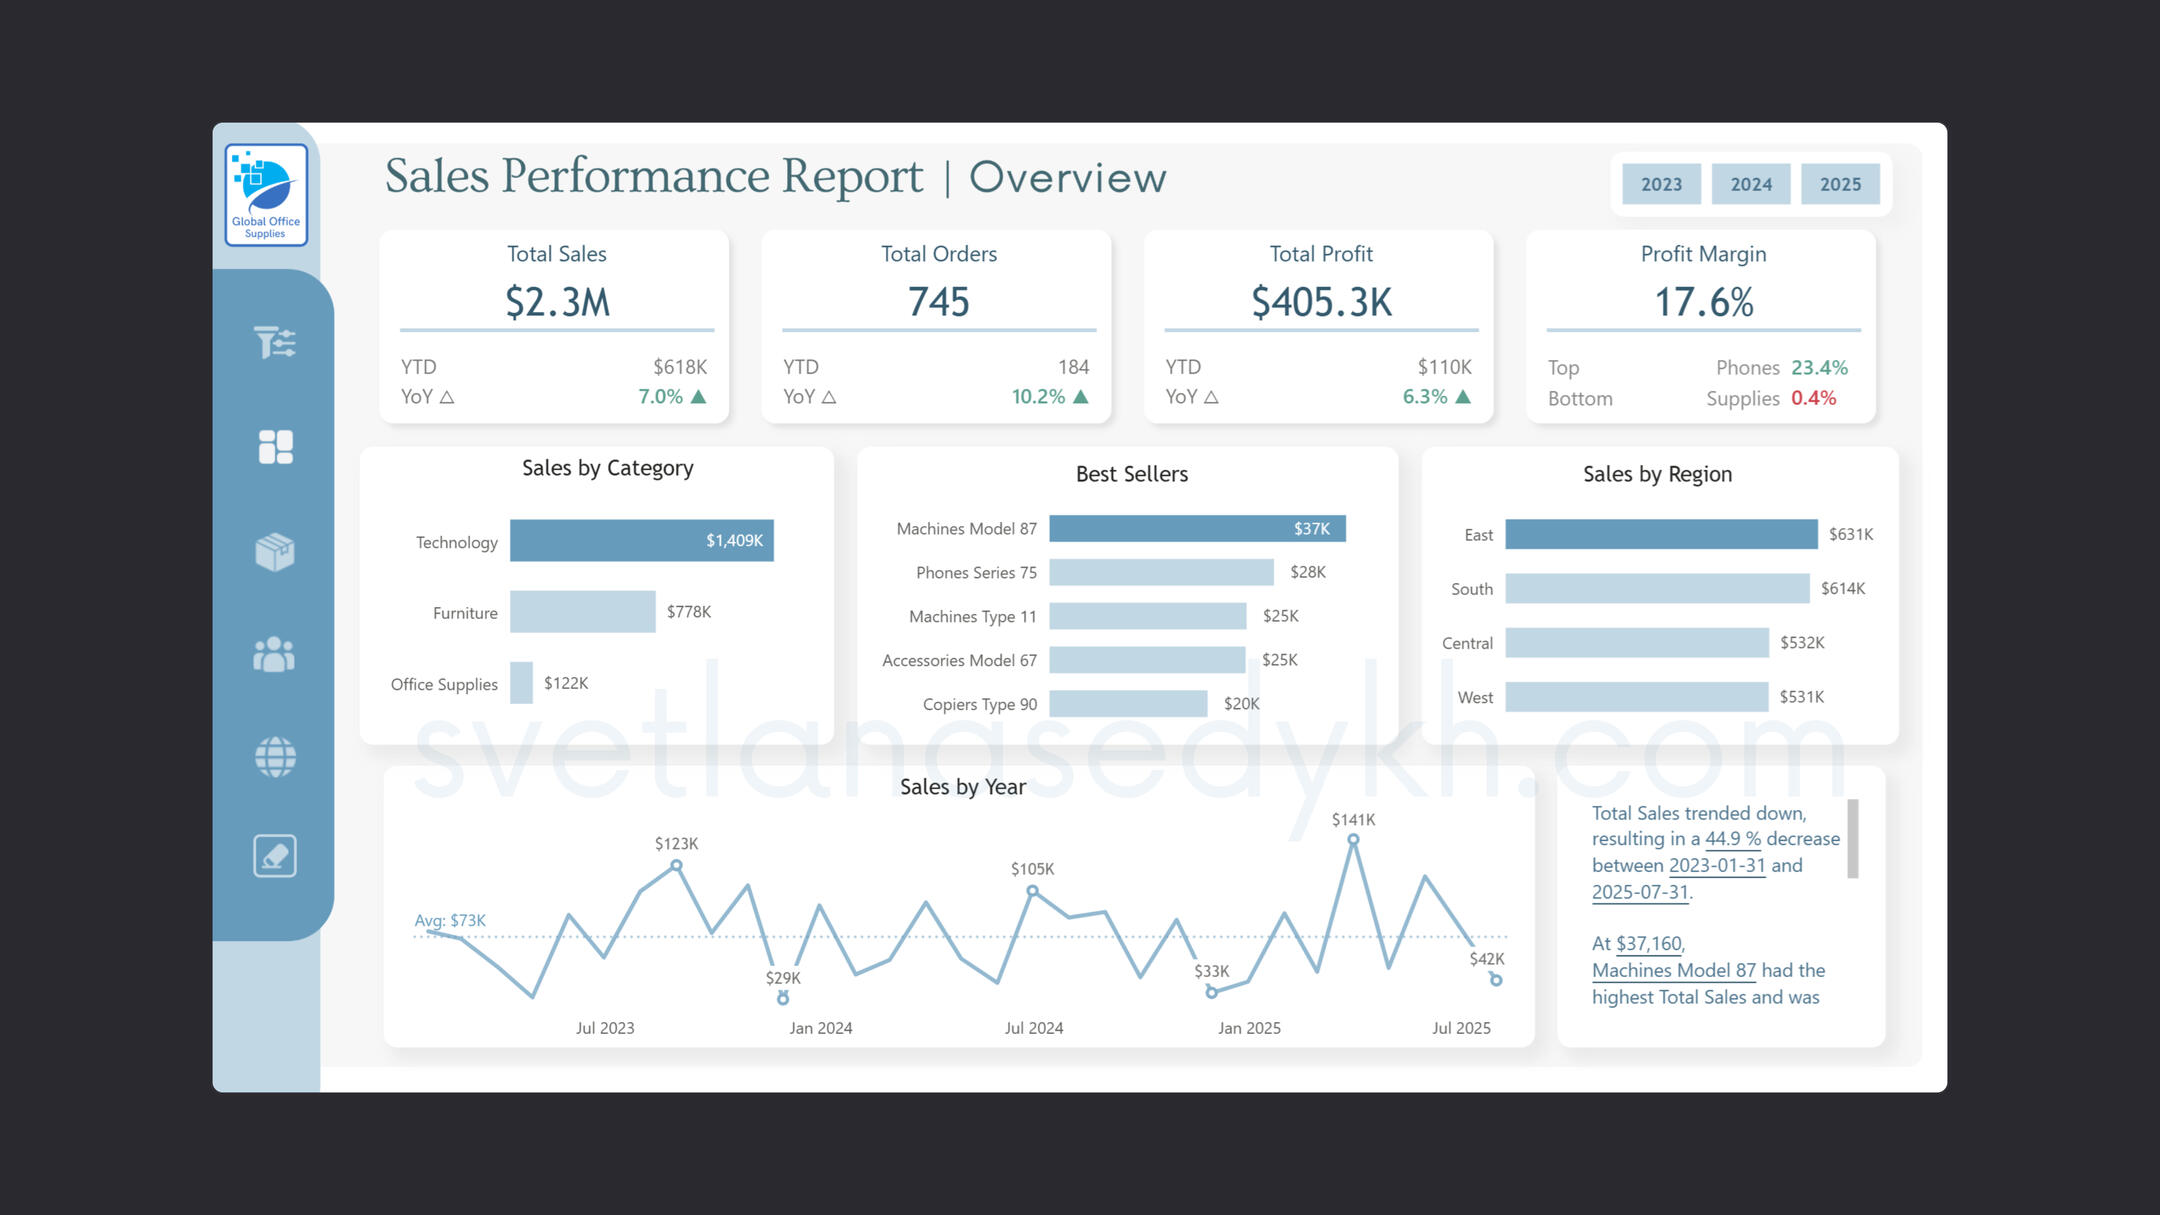
What this dashboard covers
Sales performance overview
Key KPIs tracking across all areas
Product performance and profitability
Customer insights and segmentation
Geographic sales and profit distribution
Actual vs Budget Dashboard
This Country Performance dashboard provides an Actual vs Budget revenue analysis across 7 countries, tracking variances and trends.
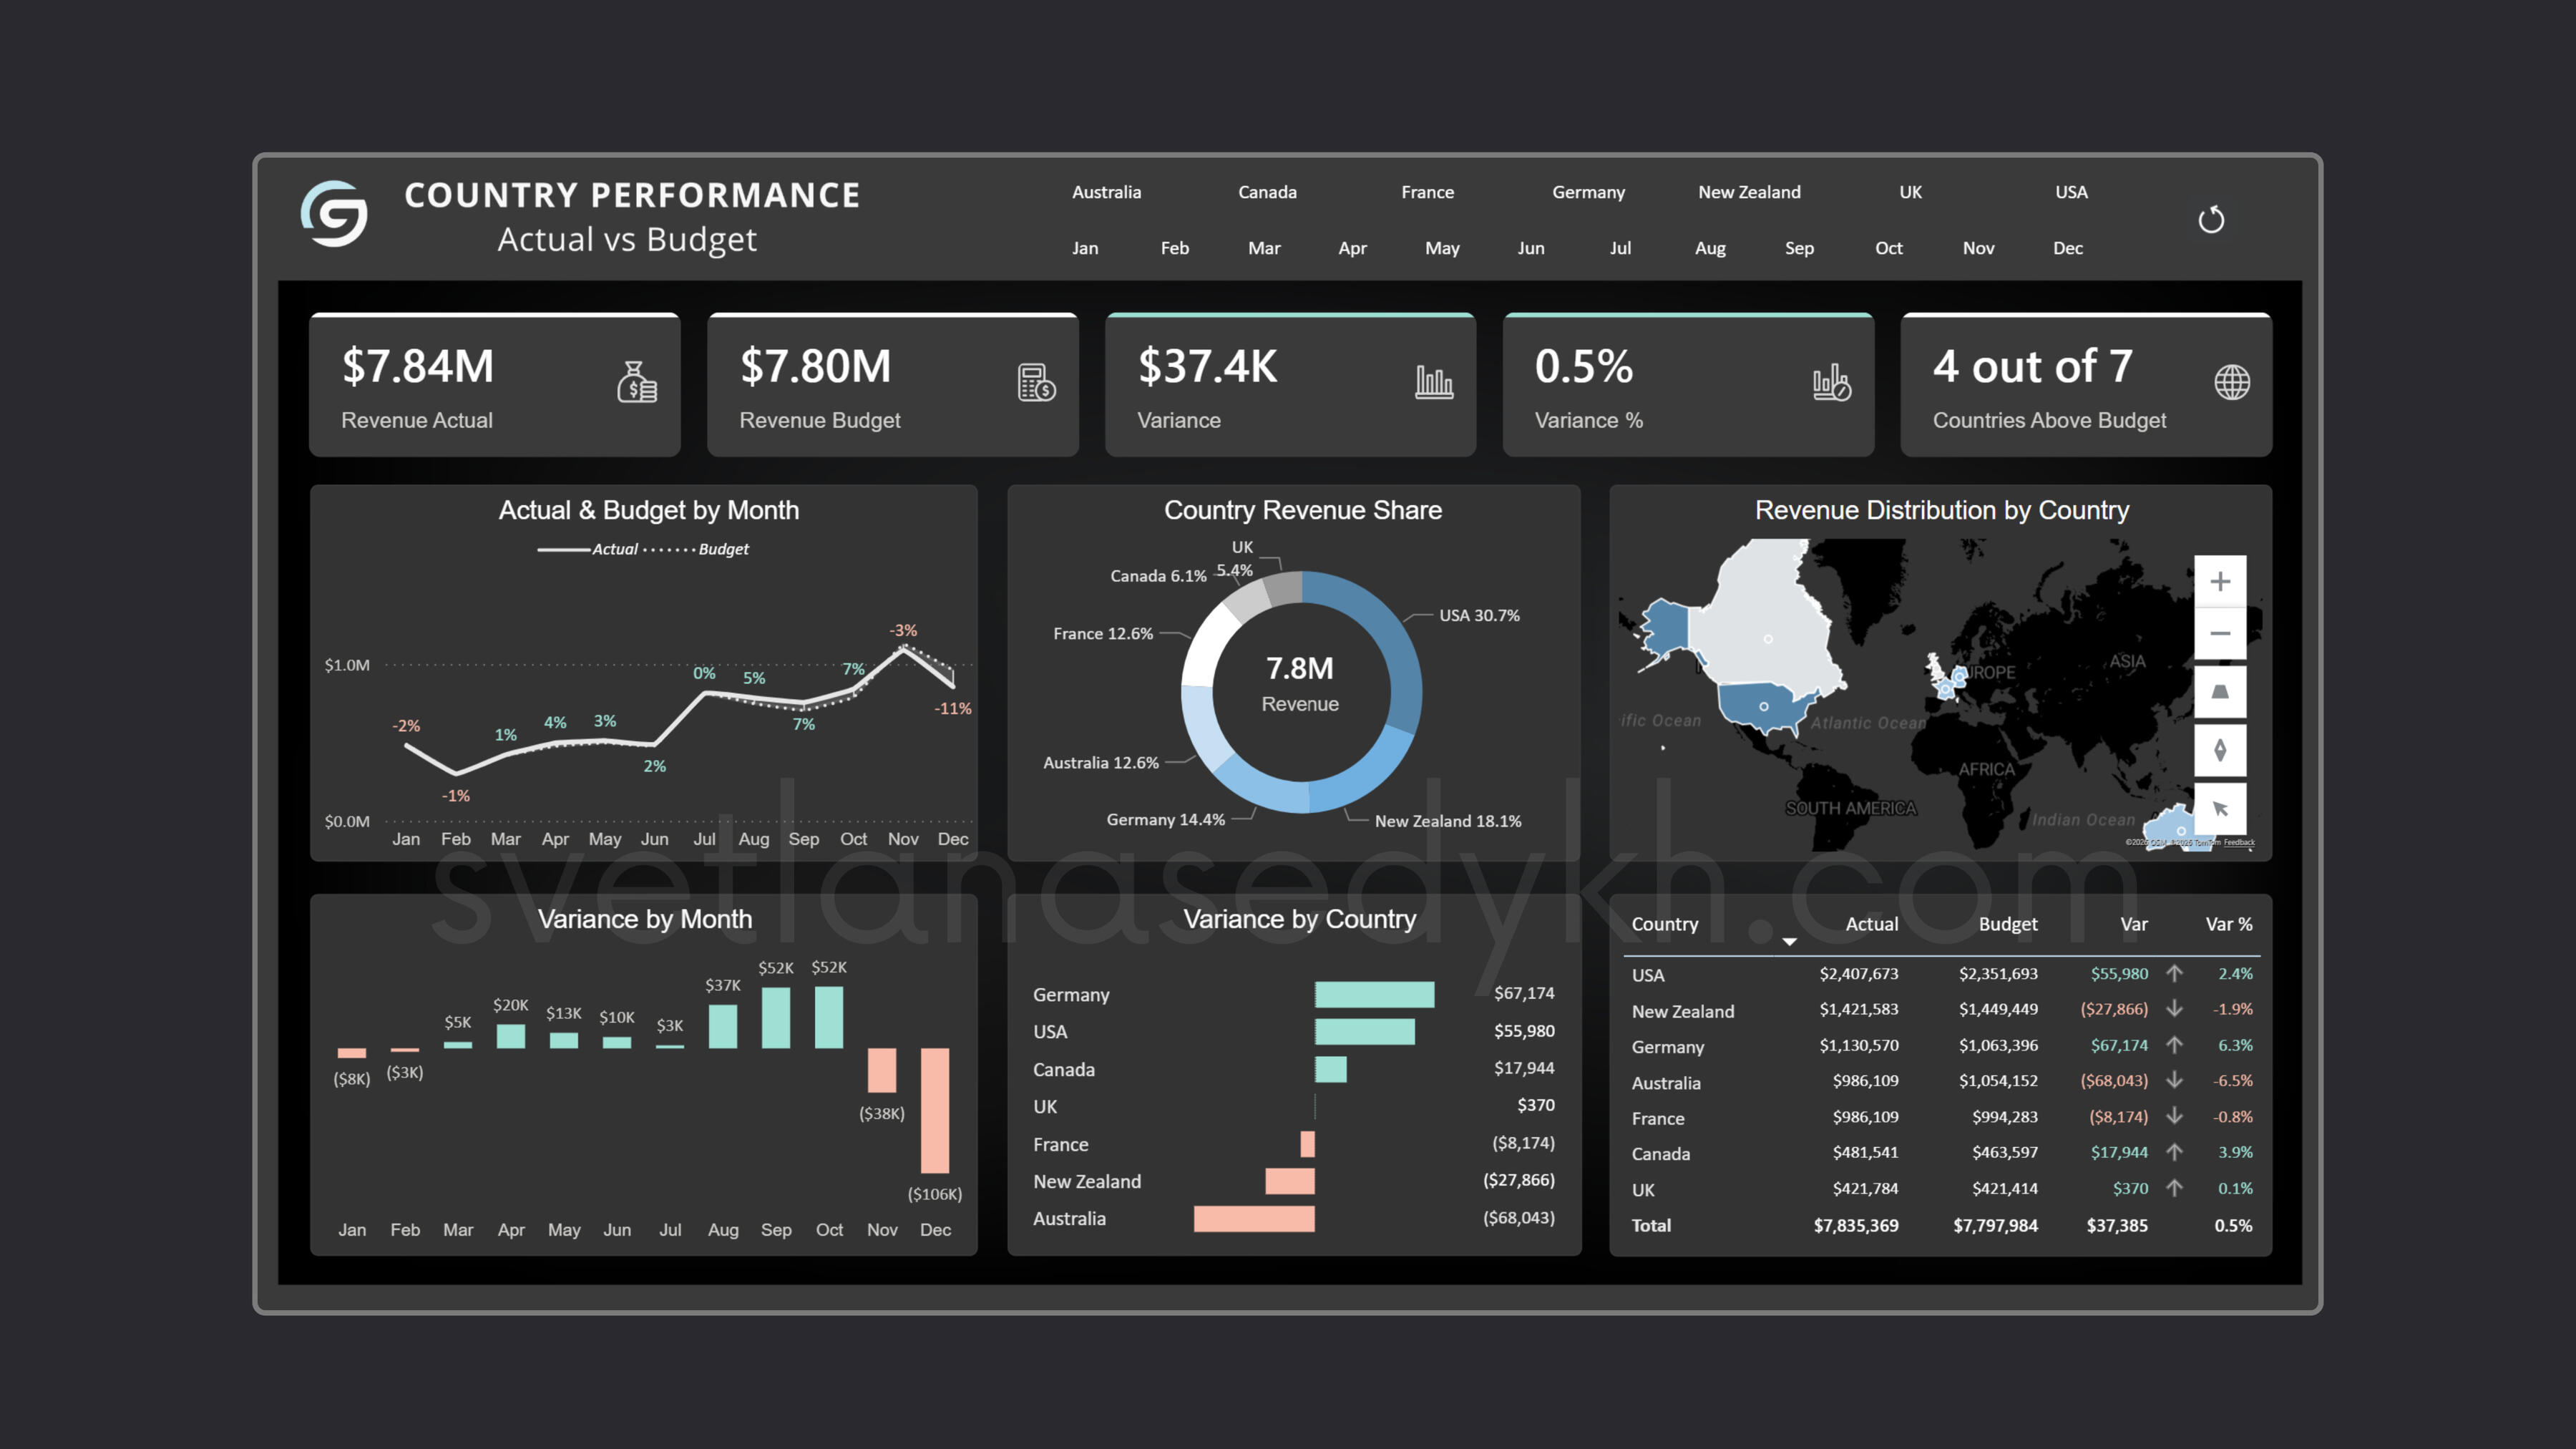
What this dashboard covers
Revenue actual vs budget by country
Variance analysis by country and month
Countries above and below target
Monthly performance trends
Country revenue share
Financial Performance Dashboard
This Income Statement Dashboard presents a full picture of financial performance with year-over-year comparisons and trend analysis.
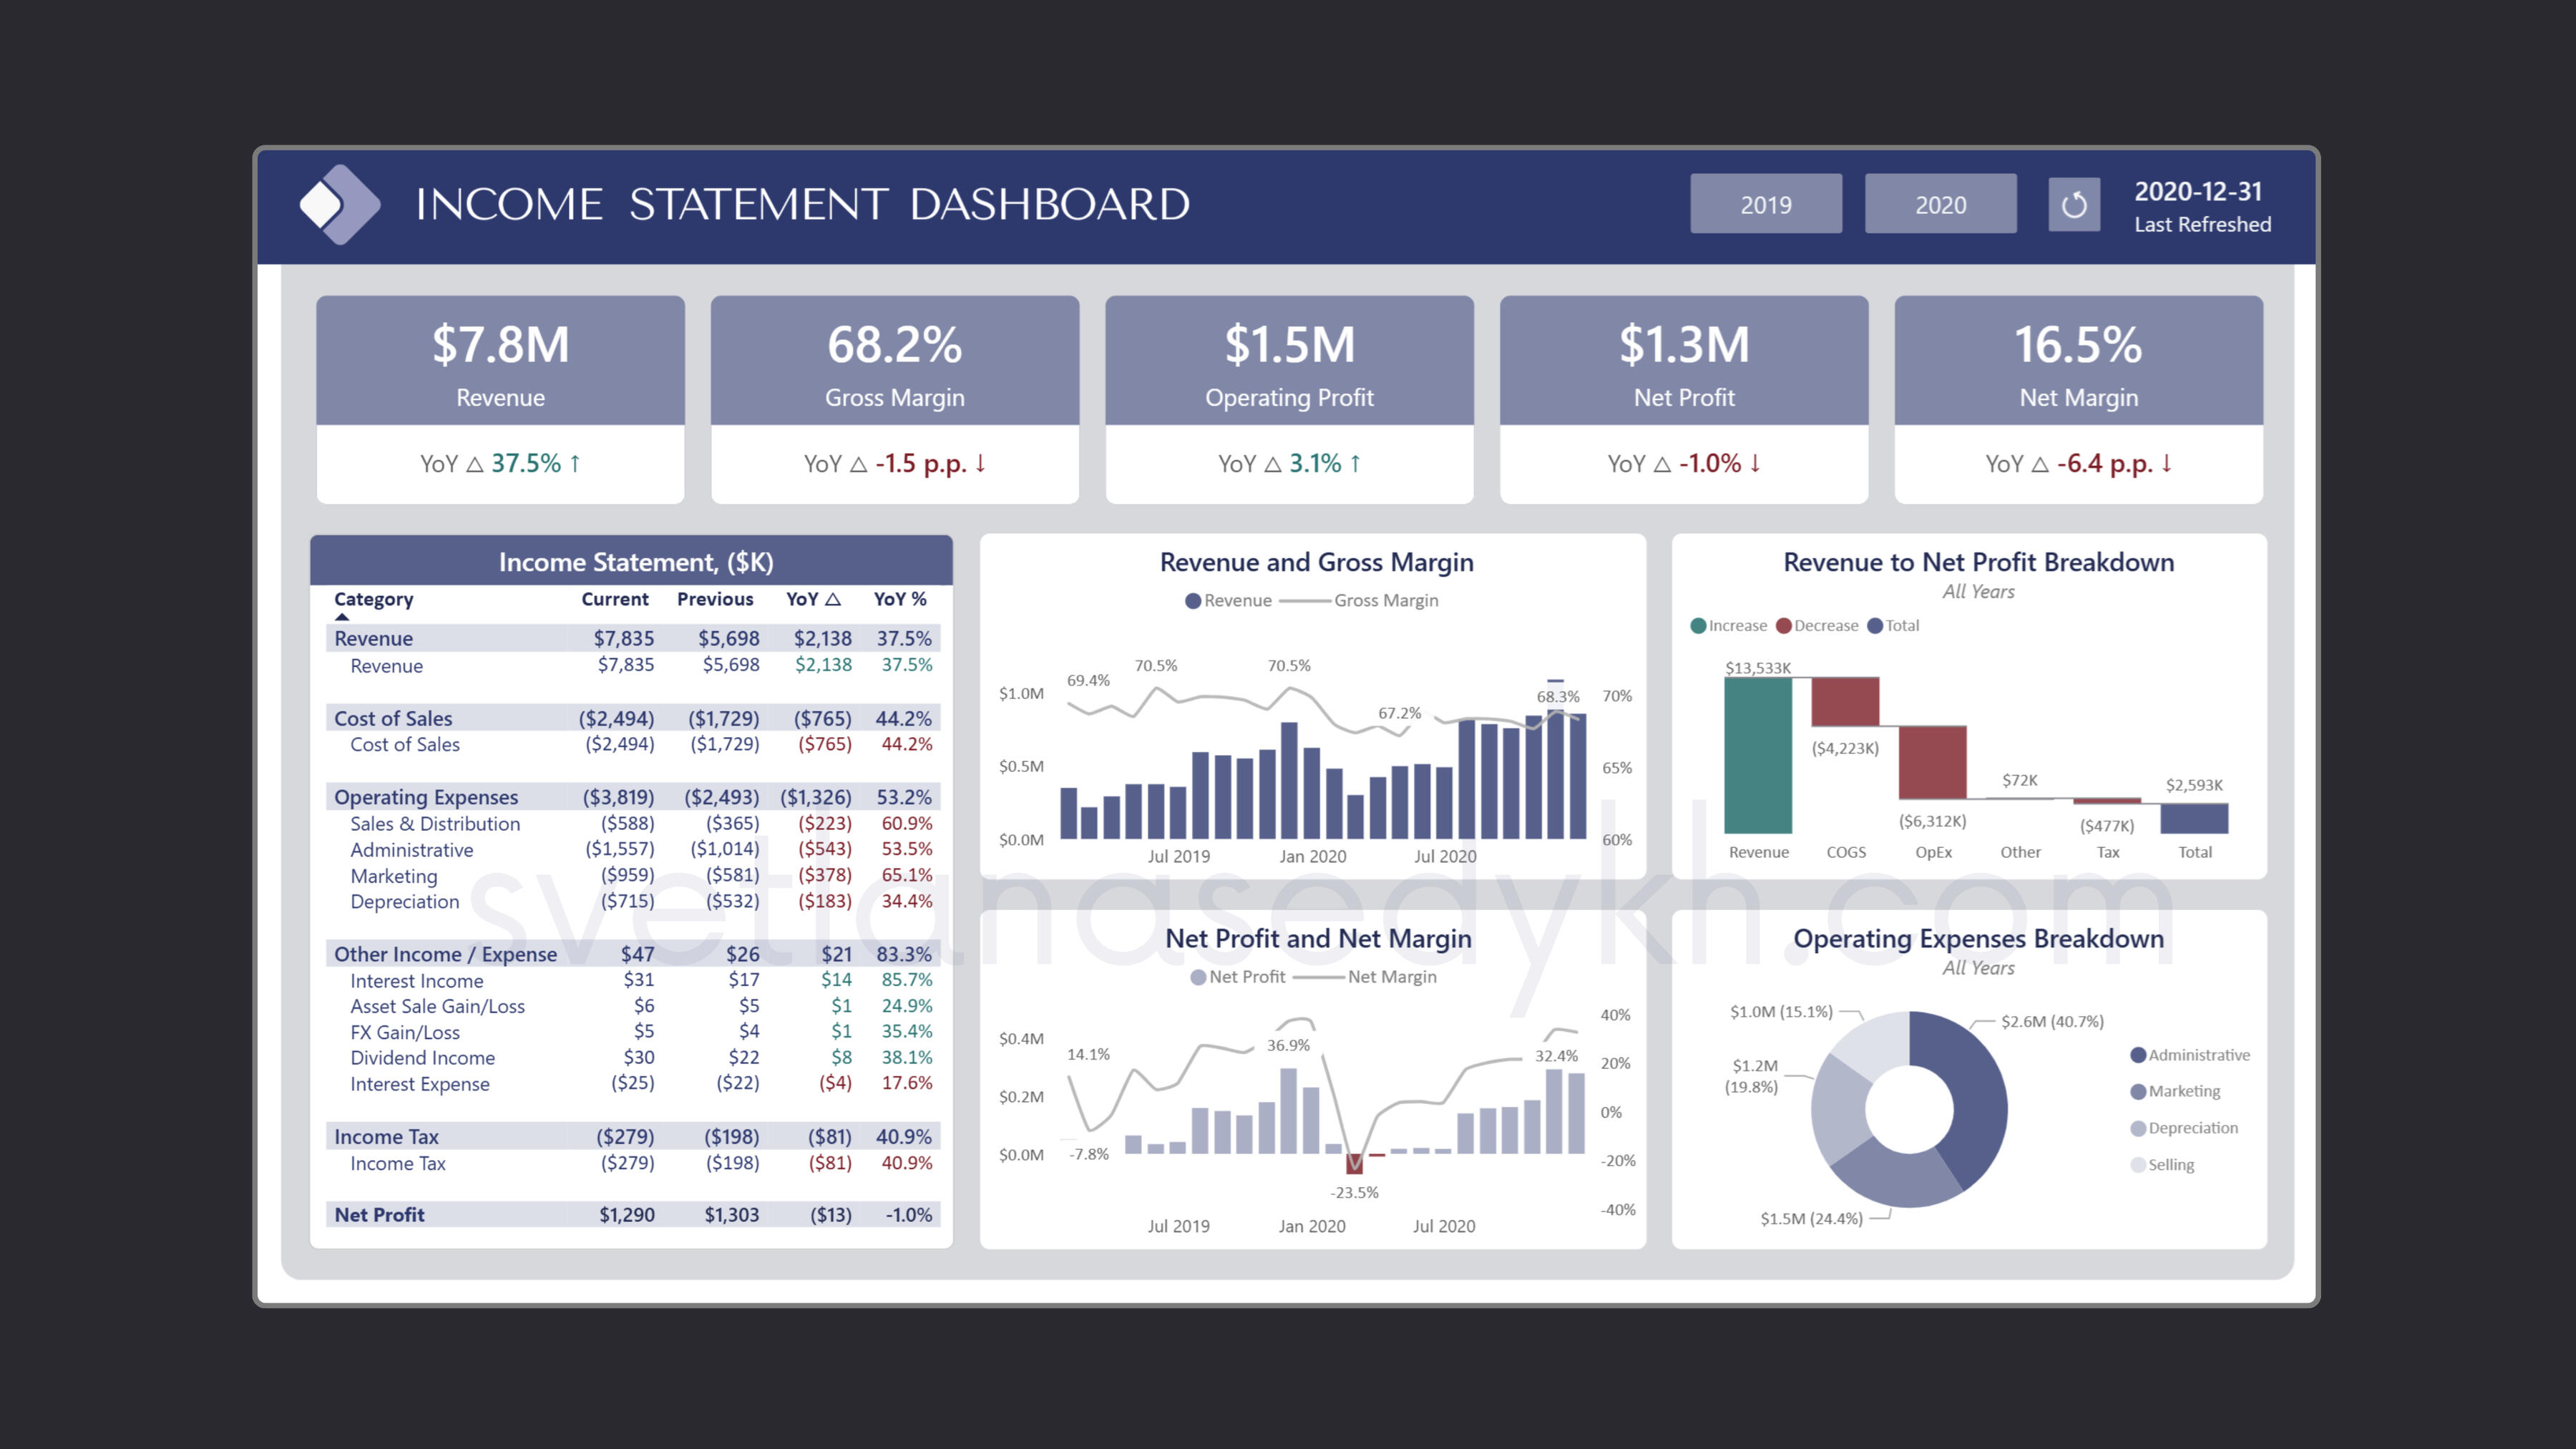
What this dashboard covers
Key financial KPIs including revenue, margins and profit
Full income statement with YoY variance
Revenue and gross margin trends
Net profit and net margin analysis
Operating expenses breakdown by category